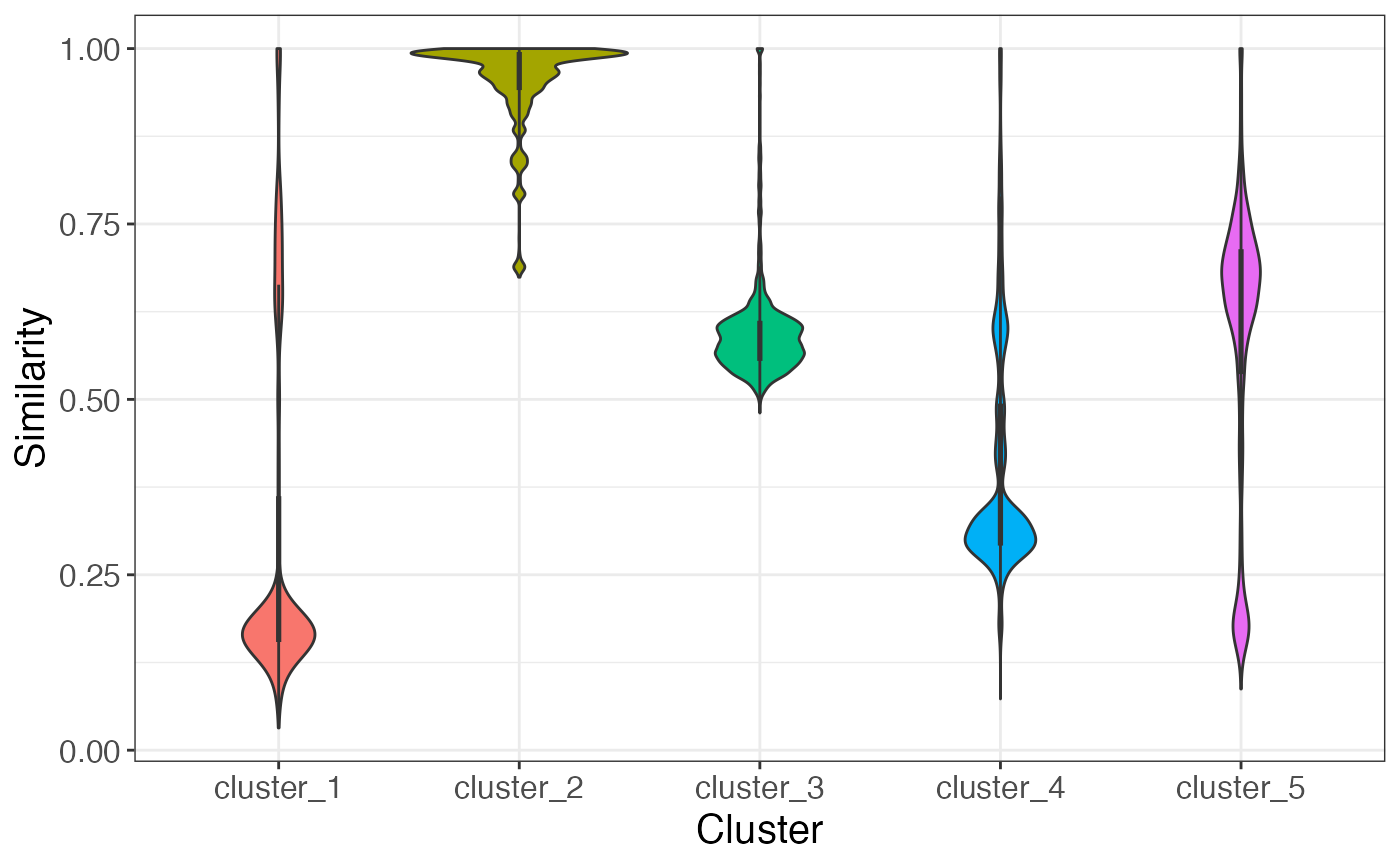
This function assess the mean/median similarity of each cluster
Arguments
- score_file
file containing the scores of each pairwise alignment
- kmeans_output
k-means file
- output_type
type of output (table or plot)
Examples
similarity_cluster(score_file, kmeans_output, output_type = "plot")

similarity_cluster(score_file, kmeans_output, output_type = "table")
#> # A tibble: 5 × 4
#>   cluster   mean_similarity median_similarity number_of_genes
#>   <chr>               <dbl>             <dbl>           <int>
#> 1 cluster_1           0.301             0.173              49
#> 2 cluster_2           0.953             0.976              78
#> 3 cluster_3           0.595             0.583             160
#> 4 cluster_4           0.405             0.326             215
#> 5 cluster_5           0.587             0.654             114
similarity_cluster(score_file, kmeans_output, output_type = "table")
#> # A tibble: 5 × 4
#> cluster mean_similarity median_similarity number_of_genes
#> <chr> <dbl> <dbl> <int>
#> 1 cluster_1 0.301 0.173 49
#> 2 cluster_2 0.953 0.976 78
#> 3 cluster_3 0.595 0.583 160
#> 4 cluster_4 0.405 0.326 215
#> 5 cluster_5 0.587 0.654 114